Gantt Schedule
Managing project timelines with the interactive Gantt chart, milestones, and dependencies.
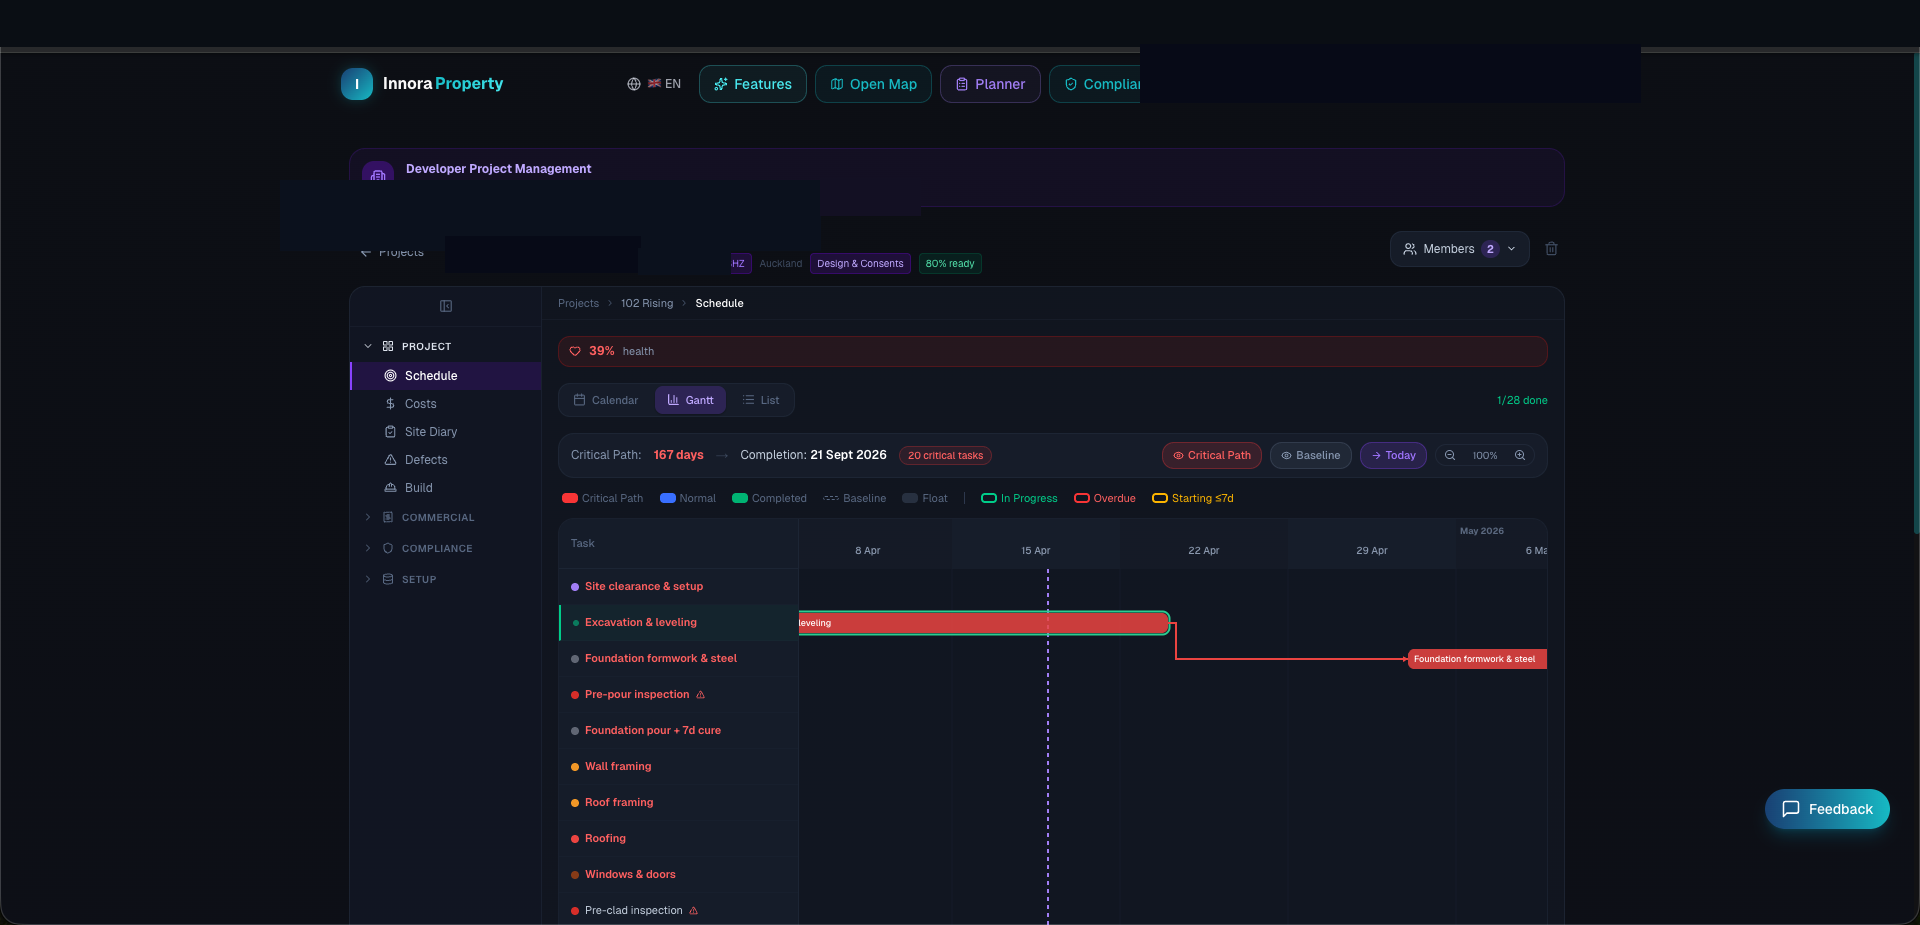
The Gantt chart provides a visual timeline of all project milestones. It supports drag-to-reschedule, milestone dependencies, critical path highlighting, and schedule template application.
Adding Milestones
- 1In the Gantt tab, click + Add Milestone.
- 2Enter: name, start date, duration (in working days), responsible party, and category.
- 3Click Save. The milestone appears as a bar on the chart.
- 4Drag the bar's left or right edge to adjust dates, or drag the centre to move the entire milestone.
Setting Dependencies
Dependencies ensure that downstream milestones cannot start before their predecessors are complete:
- 1Click a milestone to open its detail panel.
- 2Under Dependencies, click Add Dependency and select the predecessor milestone.
- 3The Gantt chart will draw a dependency arrow between the two milestones.
- 4If the predecessor is delayed, the system will calculate the impact on downstream milestones.
Critical Path
Click Show Critical Path to highlight the longest chain of dependent milestones in red. Any delay to a critical-path milestone will delay the project completion date by the same number of days.
Schedule Templates
Use Apply Schedule Template to populate the Gantt chart with a pre-built milestone set for common project types (e.g., 3-unit residential, 20-lot subdivision). Templates can be customised and saved for reuse.
Zoom & Navigation
Use the +/− zoom buttons or mouse scroll wheel to adjust the timeline scale between day-level and year-level views. The chart can be panned by clicking and dragging the timeline area.
Found an error? Open an issue on GitHub